This is part 1 in a 4-part series of findings from the 2025 Youth Washington Muslim Survey.
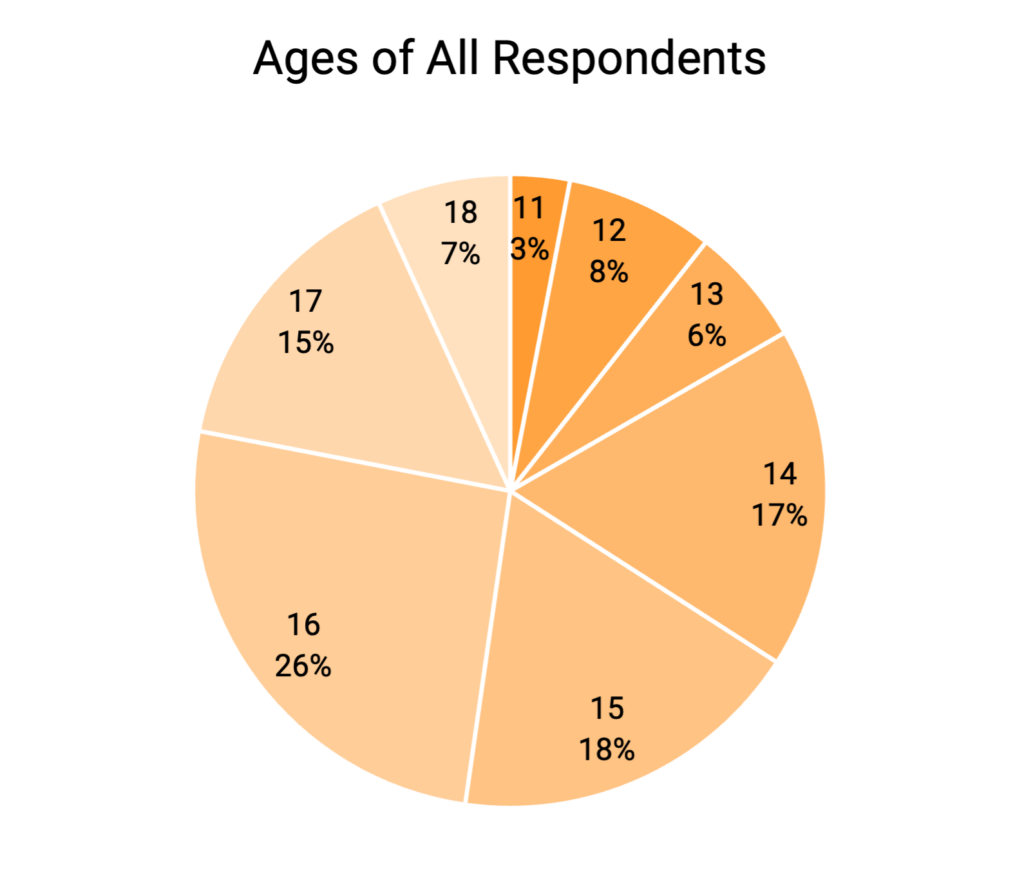
Respondents were between 11 and 18. See chart for breakdown.
Out of those who answered our question about gender, (107), 60% identified as female, 39% as male, and 1% preferred not to answer. Out of complete responses, 52% identified as female, 47% as male, and 2% preferred not to answer.
Of respondents (107), 86% attend public school, 7% attend Islamic private school, 6% attend a non-Islamic private school, and 2% attend a public charter school.
Of respondents (107), 67% attend school in King County, 8% in Pierce County, 7% in Snohomish County, 4% in Thurston County, and 2% or less in Franklin, Columbia, and Benton counties. Nine percent (9%) of respondents did not know what county in which they attend school. The cities and towns in which respondents most commonly attend school are Seattle (17%), Redmond (13%), and Bellevue (10%).
Out of 107 respondents, 8% identified as a person with a disability, and 3% preferred not to answer.
Sixty percent (60%) of respondents identify as being visibly Muslim. The percentage was the same in both samples—all respondents (107) and all complete responses (66).
Immigration Experience
Sixty-one percent (61%) of respondents have an immigration story within two generations of their family.
Sixty-four percent (63.6%) of respondents were born in the United States, 34.6% born outside of the U.S., and 1.9% preferred not to answer.
Of respondents born outside of the U.S. (32 total), two (2) identified that their families were forced to leave the country of origin because of trouble or safety, and one (1) preferred not to answer.
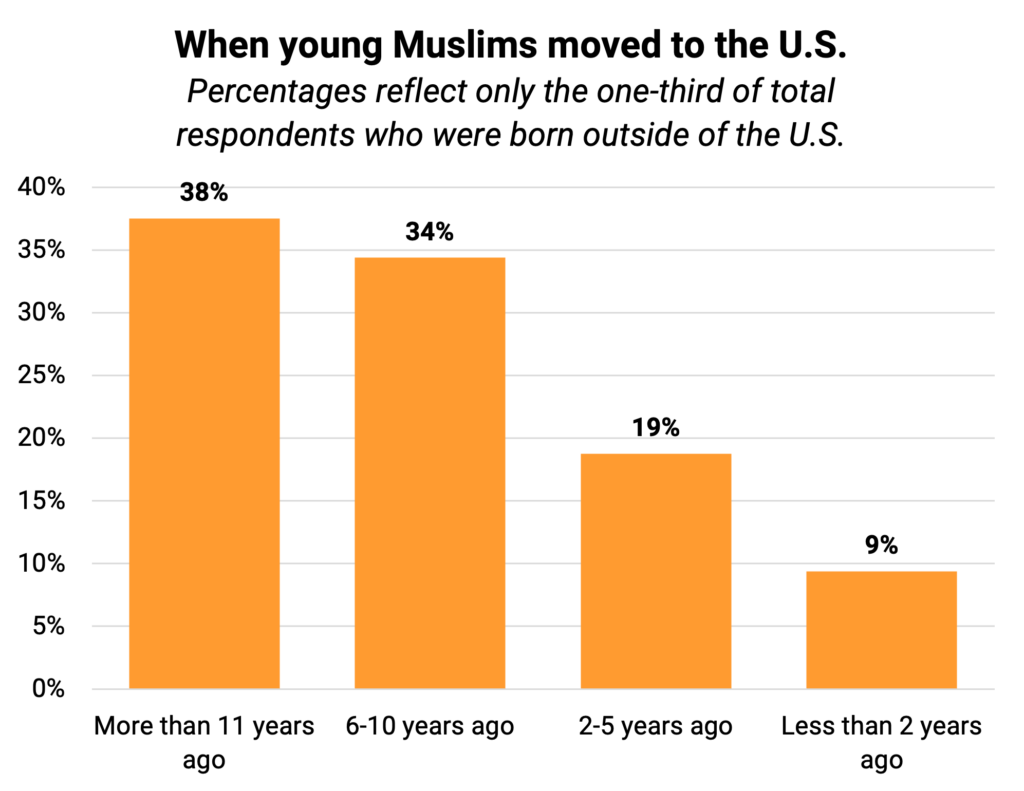
For the young people who were not born in the U.S., their families most commonly immigrated from Canada, Egypt, India, Jordan, Libya, and Saudi Arabia.
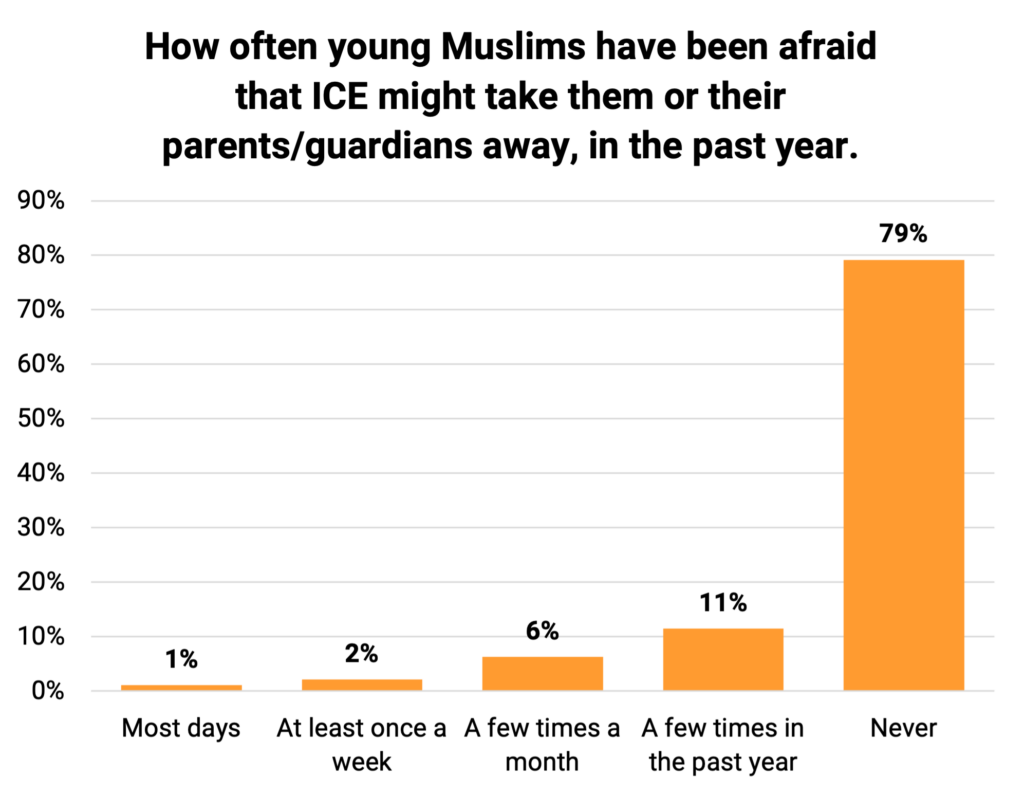
Over the past year, just over one-fifth of young Muslims in Washington (21%) have been afraid that U.S. Immigration and Customs Enforcement (ICE) would take them or their parents away.
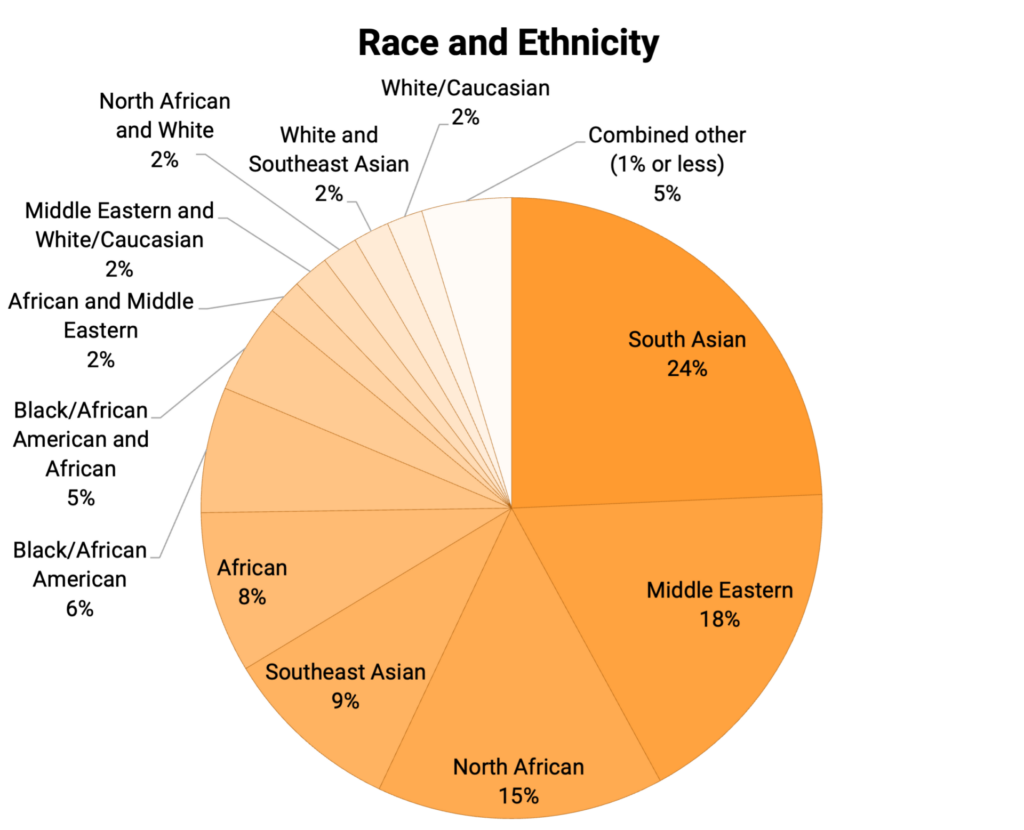
Race and Ethnicity
Young Muslims in Washington are very diverse, with no one ethnic category making up more than 24% of the total. See chart on page 8 for breakdown.
The following list is a sample of responses that respondents gave when asked to self-identify with race, ethnicity, or other ancestry characteristics.
- Afro Sudanese/Black American
- Palestinian
- Cham
- Eritrean
- Gambian (West African)
- Native North African, Amazigh
- Pakistani
- Somali
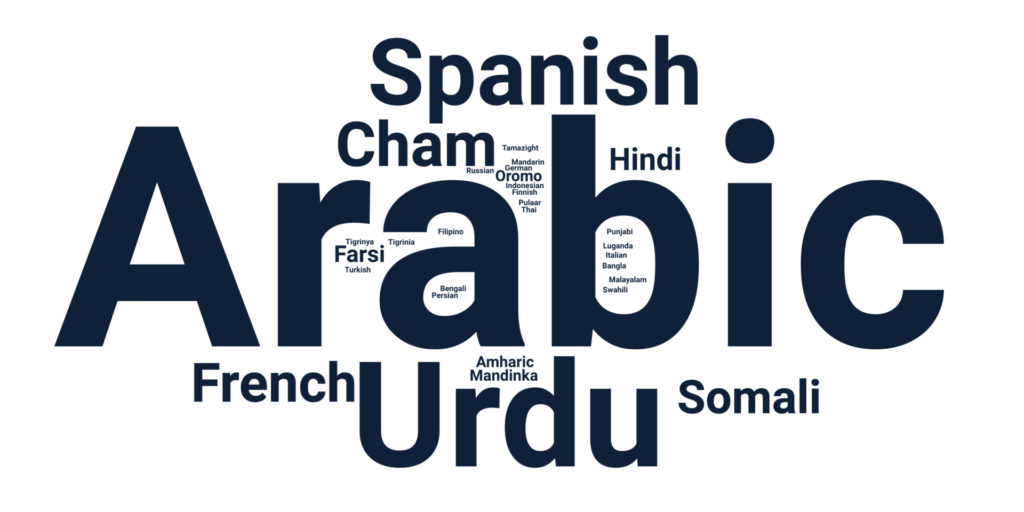
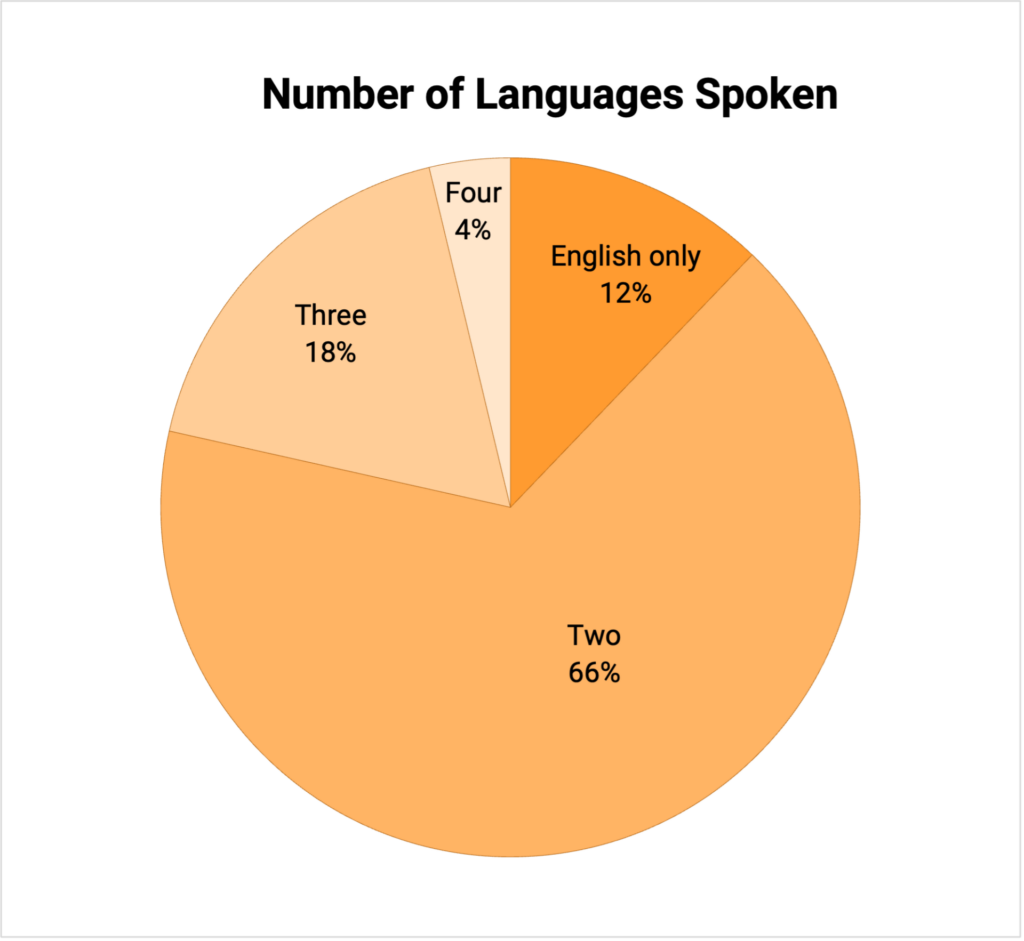
Languages
Muslim youth overwhelmingly speak multiple languages, with 88% speaking two or more languages. Out of 107 responses, there are 32 unique languages spoken.